In the world of digital retail, data is your most powerful asset. Yet many brands struggle to identify which metrics truly matter and how to use them effectively. Understanding your digital shelf performance metrics is not just about tracking numbers—it's about gaining actionable insights that drive real business results.
The Metrics That Matter Most
Not all metrics are created equal. While it's tempting to track everything, focusing on the right Key Performance Indicators (KPIs) will give you a clearer picture of your digital shelf health and opportunities for improvement.
Search Visibility
How often your products appear in search results for relevant keywords. Higher visibility means more opportunities for conversions.
Conversion Rate
The percentage of visitors who make a purchase. This metric directly impacts your ROI and overall profitability.
Share of Voice
Your brand's visibility compared to competitors in your category. Essential for understanding competitive positioning.
Content Quality Score
Measures completeness and quality of product content, including images, descriptions, and specifications.
1. Search Visibility and Organic Ranking
Search visibility is the gateway to all other metrics. If customers can't find your products, nothing else matters. This metric tracks how often your products appear in search results and at what position.
What to Track:
- Keyword rankings: Position of your products for target search terms
- Search impression share: How often your products appear vs. total possible impressions
- Click-through rate (CTR): Percentage of searchers who click on your product listing
- Organic vs. paid visibility: Balance between natural search presence and advertising
Why it matters: Higher search visibility directly correlates with increased traffic and sales opportunities. Products ranking on the first page receive 75% of all clicks, while those on page two see dramatically lower engagement.
"Products appearing in the top three search results receive 10x more traffic than those in positions 10-12, making search visibility the single most important metric for digital shelf success."
2. Conversion Rate Optimization
Your conversion rate tells you how effectively your product listings turn browsers into buyers. While industry averages hover around 2-3%, top-performing products achieve conversion rates of 5% or higher.
Key Conversion Metrics:
- Overall conversion rate: Total purchases divided by total visits
- Add-to-cart rate: How many visitors add products to their cart
- Cart abandonment rate: Percentage of users who add items but don't complete purchase
- Conversion by traffic source: Which channels drive the highest-quality traffic
- Time to conversion: How long it takes visitors to make a purchase decision
Optimization strategies: Improving conversion rates often requires a multi-faceted approach including better product images, more detailed descriptions, competitive pricing, prominent customer reviews, and clear shipping information.
3. Content Quality and Completeness
Content quality directly impacts both search visibility and conversion rates. Platforms like Amazon, Takealot, and others use content quality as a key ranking factor in their search algorithms.
Content Quality Indicators:
- Content completeness score: Percentage of required and recommended fields filled out
- Image count and quality: Number of images, resolution, and variety (lifestyle, detail shots, etc.)
- Description length and richness: Comprehensive product information including features, benefits, and specifications
- Enhanced content utilization: Use of A+ content, brand stores, and rich media
- SEO optimization score: Keyword integration and search relevance
Research shows that products with complete, high-quality content see conversion rates 40% higher than those with minimal information. Additionally, rich content reduces return rates by helping customers make more informed purchase decisions.
4. Price Competitiveness and Buy Box Percentage
Price remains one of the most influential factors in purchase decisions. However, being the cheapest isn't always the goal—price competitiveness should be evaluated within the context of your brand positioning and profit margins.
Price-Related Metrics:
- Price position vs. competitors: Where your pricing sits relative to similar products
- Buy Box win rate: How often you win the featured offer position (for marketplace sellers)
- Price elasticity: How sales volume responds to price changes
- Promotional effectiveness: Impact of discounts and deals on sales velocity
- Margin health: Ensuring profitability while remaining competitive
Strategic insight: The goal isn't necessarily to have the lowest price, but to understand your price positioning and ensure it aligns with your brand value proposition. Premium brands should focus on value communication rather than price competition.
5. Customer Reviews and Rating Performance
Reviews are social proof in digital form, and they significantly impact purchase decisions. Products with reviews see conversion rates 3-4x higher than those without.
Review Metrics to Monitor:
- Average star rating: Overall product rating (target: 4.0+ stars)
- Review count: Total number of reviews (more reviews = higher trust)
- Review velocity: How quickly you're accumulating new reviews
- Review sentiment: Positive, negative, and neutral review distribution
- Review response rate: How often you respond to customer feedback
- Verified purchase percentage: Ratio of verified vs. unverified reviews
Actionable insights: Analyze review content to identify common themes, feature requests, and pain points. Use this qualitative data to improve products, update descriptions, and address concerns proactively.
6. Share of Voice and Competitive Position
Share of Voice (SOV) measures your visibility compared to competitors within your category. This metric helps you understand your competitive position and identify market opportunities.
SOV Components:
- Search share: Percentage of search impressions your brand captures vs. competitors
- Category presence: Representation in key category pages and filters
- Sponsored placement share: Visibility in paid advertising positions
- Best seller ranking: Position in category best seller lists
Growing your share of voice often requires a combination of improved organic presence and strategic advertising investment. The goal is to capture more category mindshare and establish brand dominance.
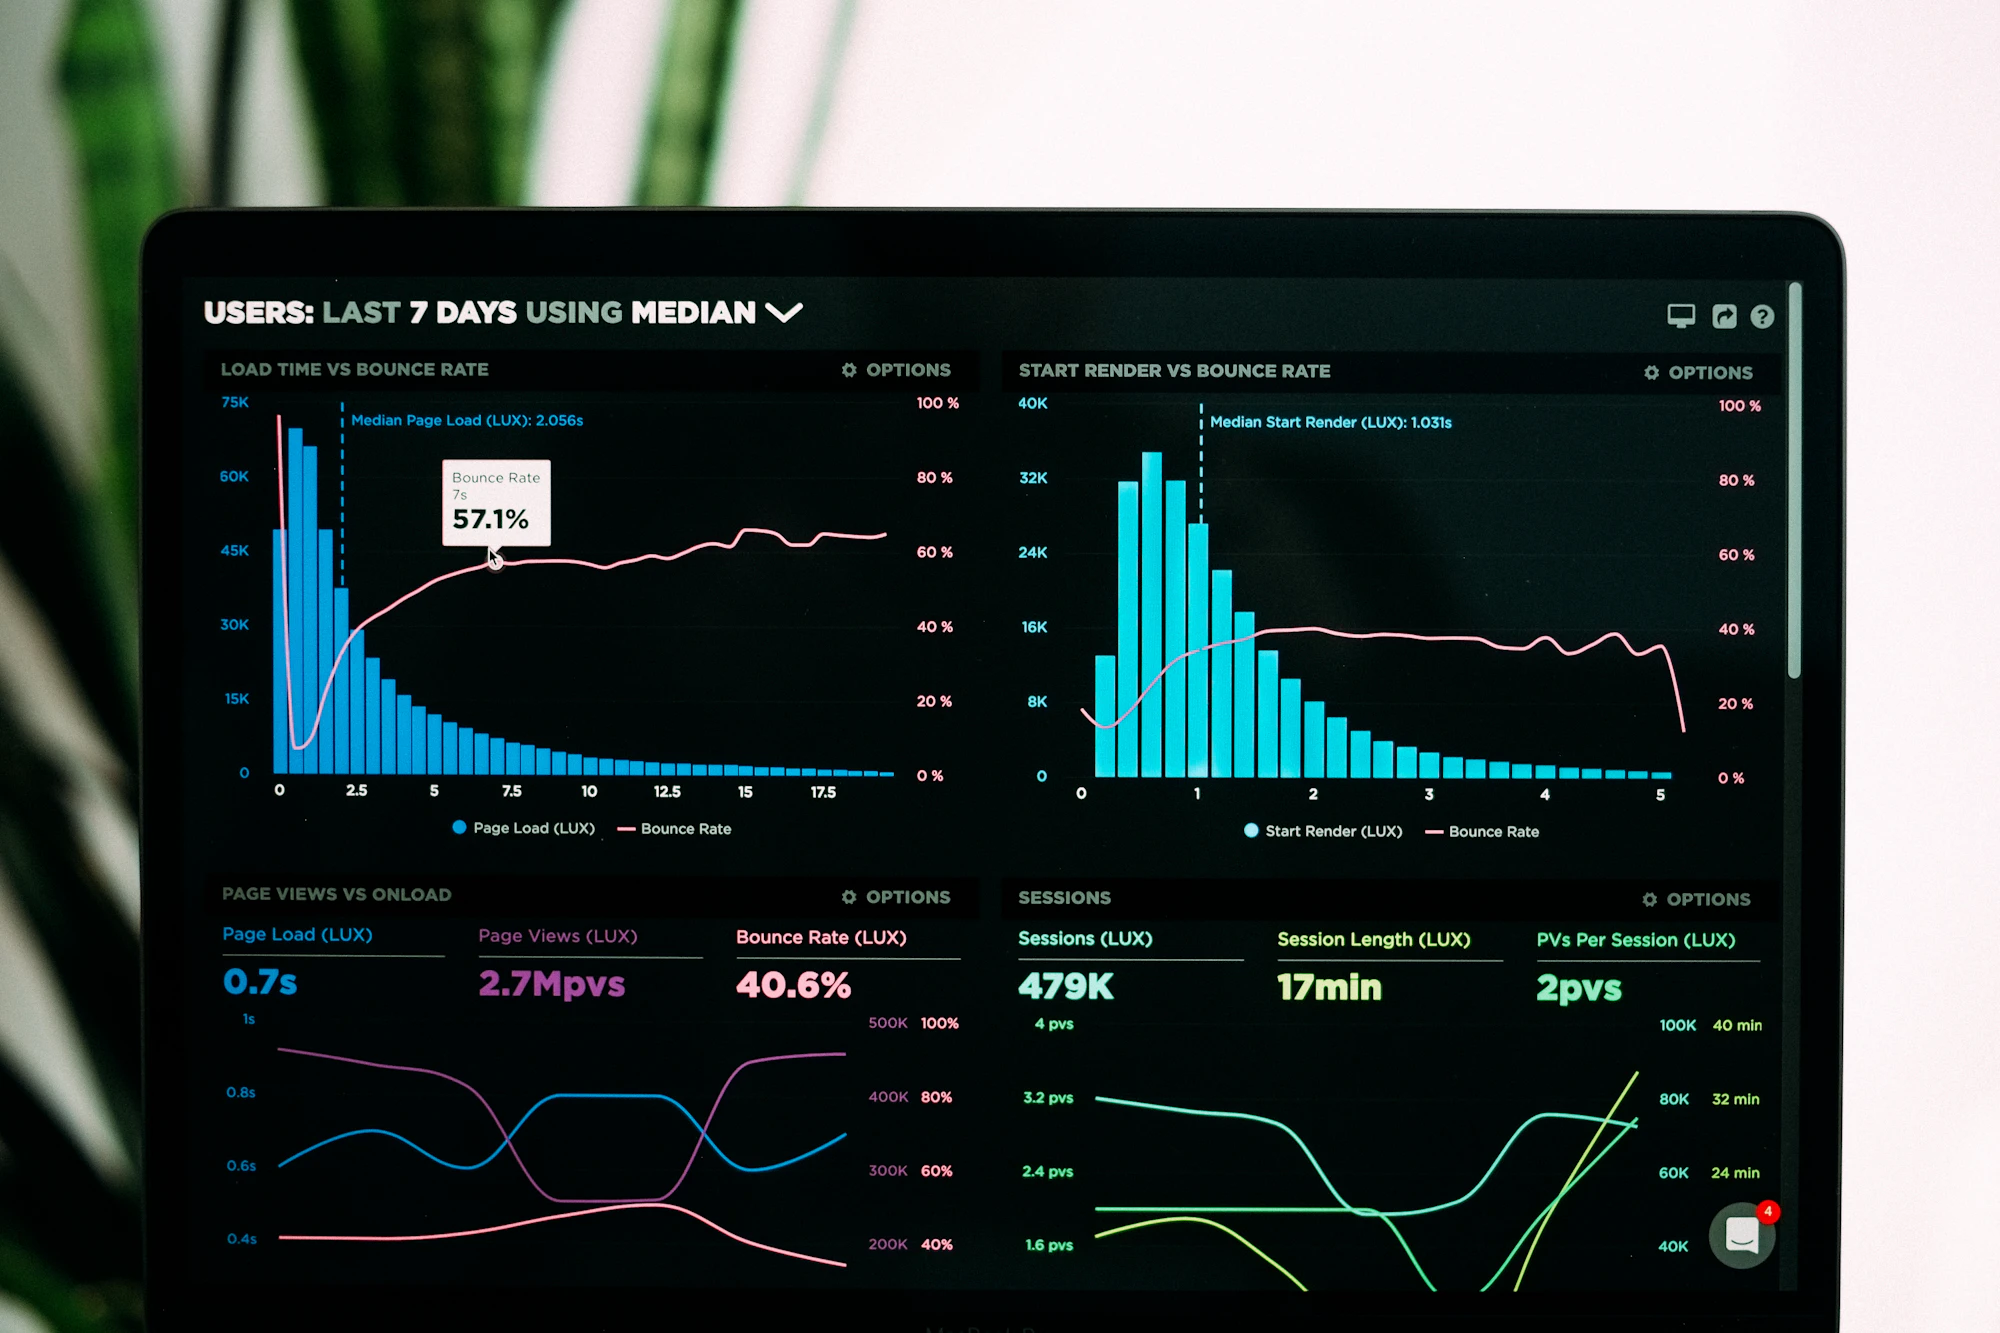
Creating Your Performance Dashboard
The key to actionable analytics is effective visualization. Create a dashboard that brings together your most important metrics in a clear, easy-to-understand format.
Dashboard Best Practices:
- Prioritize key metrics: Focus on the 5-7 metrics that most impact your goals
- Set clear benchmarks: Establish targets and track progress over time
- Enable comparison views: Compare performance across products, categories, and time periods
- Include competitive context: Show your performance relative to market benchmarks
- Create actionable alerts: Set up notifications for significant changes or opportunities
Turning Data Into Action
Collecting metrics is only the first step. The real value comes from translating data into strategic actions that improve performance.
Action Framework:
- Regular review cadence: Weekly tactical reviews and monthly strategic assessments
- Identify trends: Look for patterns and correlations across metrics
- Prioritize opportunities: Focus on high-impact, achievable improvements
- Test and iterate: Implement changes, measure results, and refine strategies
- Document learnings: Build a knowledge base of what works in your category
Conclusion: The Path to Data-Driven Excellence
Understanding and leveraging your digital shelf performance metrics is essential for sustained e-commerce success. By focusing on the right KPIs, creating effective dashboards, and consistently turning insights into action, you can optimize your digital presence and drive significant growth.
Remember: metrics are a means to an end, not the end itself. The goal is to create better shopping experiences, increase customer satisfaction, and build a sustainable competitive advantage in the digital marketplace.
At Instore, we provide comprehensive analytics tools and expert guidance to help brands master their digital shelf performance. Our platform brings together all the metrics that matter in one intuitive dashboard, with AI-powered insights that identify opportunities and recommend specific actions.
Ready to Optimize Your Performance?
Let us help you implement a data-driven approach to digital shelf success. Get comprehensive analytics and expert insights to maximize your e-commerce potential.
Schedule a Demo